Inventa

a computational tool to discover chemical novelty in natural extracts libraries
Version 1.0
Publication Examples
This images and interactive plots are presented in the publication of Iventa.

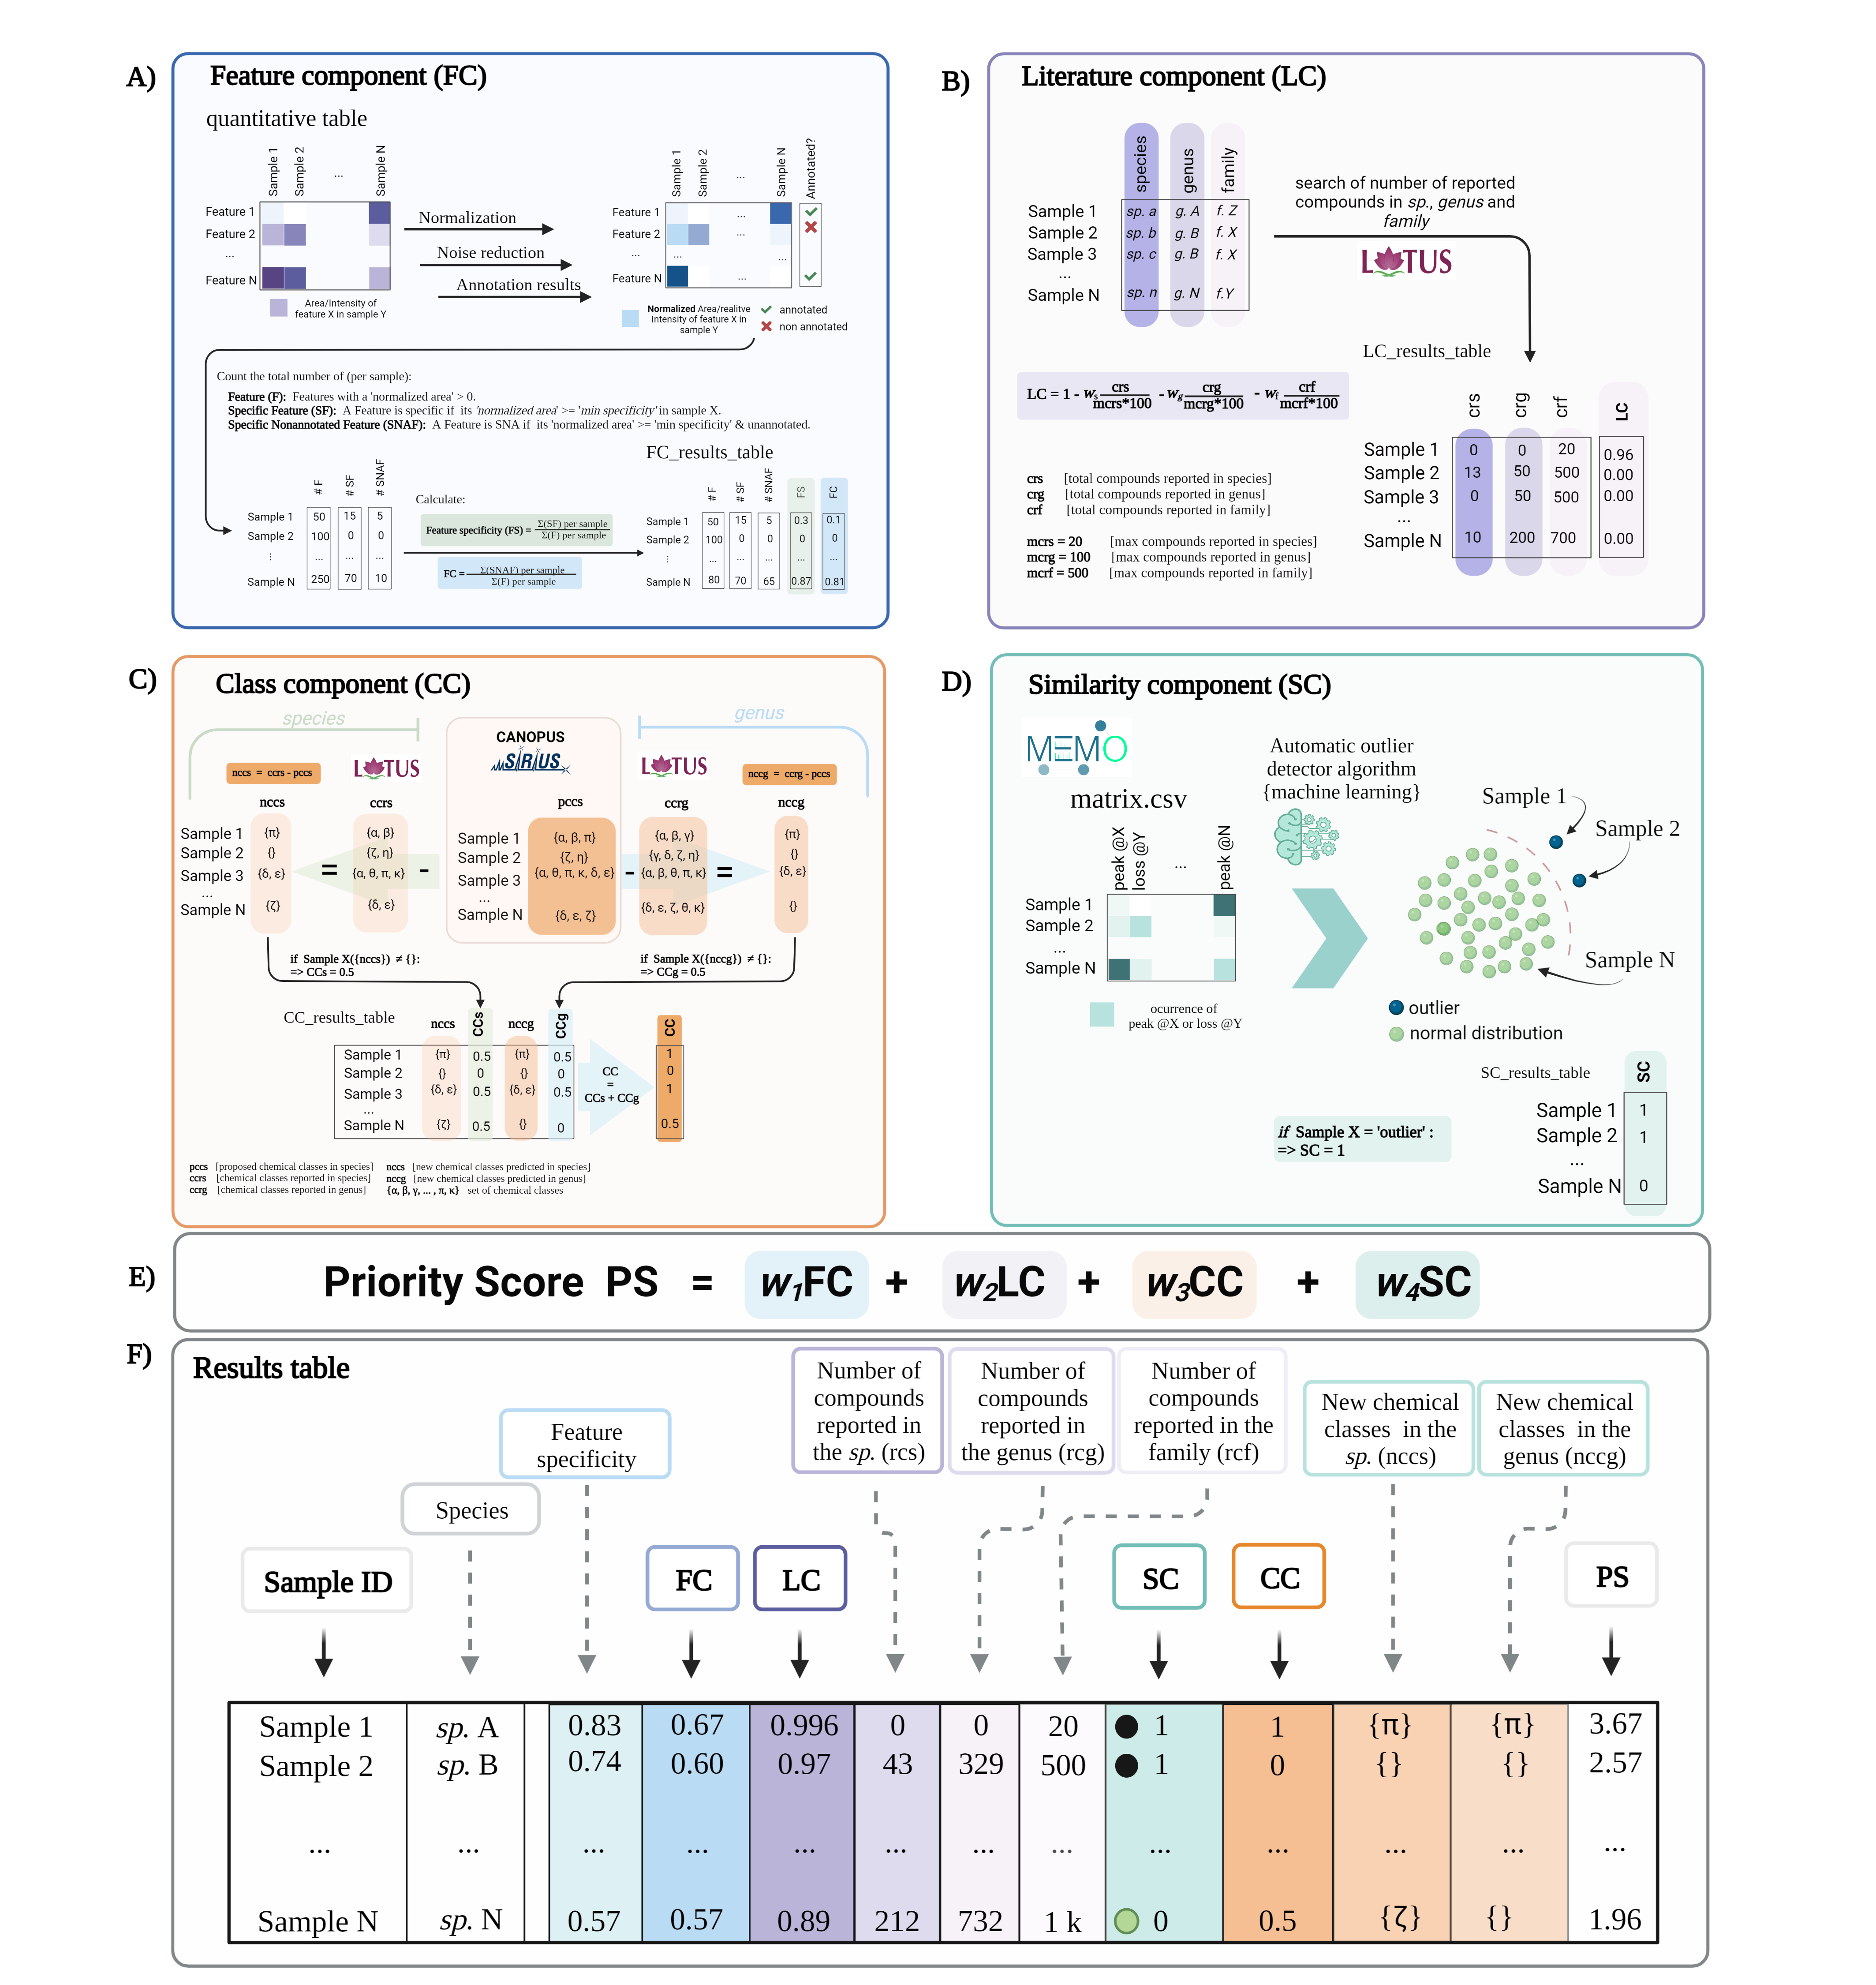
Figure 1. Conceptual overview of Inventa’s priority rank and its individual components. (A) Feature Component (FC): a ratio from 0 to 1 considering the proportion of features with a ‘specificity’ higher than the minimum specificity value set by the user and lack of annotation per sample. The ‘Feature specificity’ shows the proportion of features with a ‘specificity’ higher than the minimum specificity value set by the user per sample. (B) Literature Component (LC): a ratio from 0 to 1 considering a ‘minimum of reported compounds’ set by the user and the number of compounds reported in the databases for the taxon. The closer the value to ‘1’ the less compounds are reported for the sample. Additional columns show the total number of reported compounds at the species and genus levels. (C) Similarity Component (SC): a score considering the spectral dissimilarity of the samples within the set. A machine learning algorithm is used to detect the outliers (value ‘1’) from the rest (value ‘0’) in the set based on a vectorized matrix. (D) Class Component (CC): a score considering the presence of predicted known chemical classes new to the species (value ‘1’). It is a product of the difference found between the chemical classes predicted by SIRIUS and the ones reported in the databases for a specific species. Additional columns show the specific ‘new’ known chemical classes at the species and genus levels. The Priority rank (PR) is the addition of the four components. A modulating factor (wn) allows to give a relative weight to each component according to the user’s preferences. The higher the value the higher is the rank of the sample.